A self-built COVID-19 Radar Station
Earlier this year I designed and built a website, which collects data – in real-time – from the Dutch National Weather Service (KNMI). It also collects data from the Dutch National Institute for Public Health and the Environment (RIVM). The website was built based on the research I did and published, together with scientists from two universities. During our research we found strong evidence of a correlation between humidity and the spread of respiratory viruses; Influenza and SARS-CoV-2. In our paper we wrote:
An increase of specific humidity of one gram of water vapor per kilogram of air (1 g/kg) is related to a reduction of approximately 5% in the risk of COVID-19 infections. Conclusion: The increase in humidity during the outbreak of the SARS-CoV-2 in the Netherlands helped to reduce the risk of regional COVID-19 infections. Public policies that promote higher levels of specific humidification-above 6 g/Kg-can lead to significant reductions in the spread of respiratory viruses, such as influenza and SARS-CoV-2.
How the website works
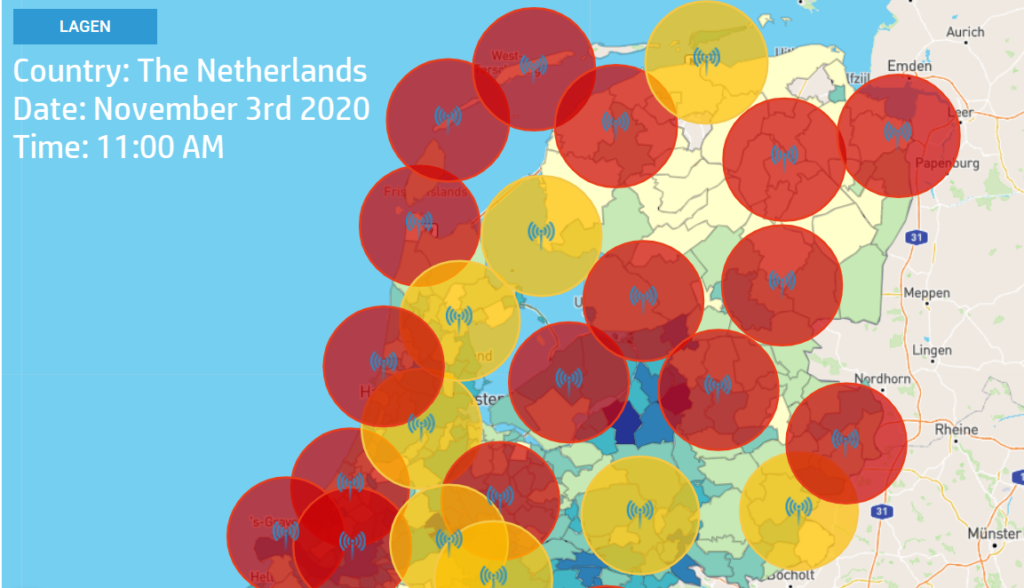
The website translates Relative Humidity (RH) into Specific Humidity (q). Based on the values, per weather station, the map on the website shows the weather stations in different colors. The colors represent:
- GREEN – Specific Humidity (q) above 8 g/Kg = Very low Aerosol (infectivity)
- YELLOW – Specific Humidity (q) between 7 and 8 g/Kg = Low Aerosol (infectivity)
- ORANGE – Specific Humidity (q) between 6 and 7 g/Kg = Moderate Aerosol (infectivity)
- RED – Specific Humidity (q) below 6 g/Kg = High Aerosol (infectivity)
The earlier forecast
The purpose of the website is akin to that of a National Weather Service; provide the population of The Netherlands with relevant information so they know if they need to bring ‘an umbrella’ (ie. wear a face mask). On the 27th of October I posted an image on Facebook, showing what I believe to be evidence of a correlation between a low humidity and increased spread of SARS-CoV-2 in The Netherlands, 7 days later. It turns out that the data published by the RIVM was incorrect and has since then been corrected.
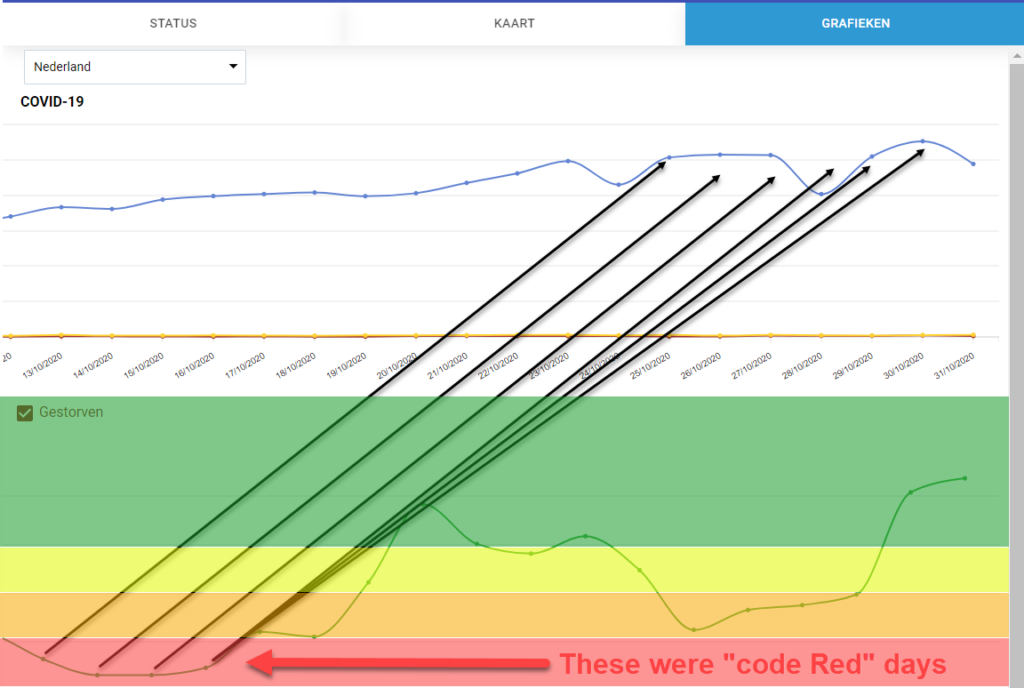
Above is the corrected data (thankfully the website auto-corrects all the values when RIVM changes its data). What you are seeing in the image above is 4 days (October 14th – 17th) where, throughout the entire country, the Specific Humidity was below 6 g/Kg (Being ‘Code Red‘). 11 days later we had a period of 5 days (October 25th – 30th) where the daily COVID-19 cases rose above 10,000. Not so coincidentally in our research paper we also wrote:
Given the seasonal dynamics of humidity in the last 5 years, an uptake (second wave) of SARS-CoV-2 infections can be expected during the weeks 43 to 45 of 2020, if low levels of humidity—below 6 g/Kg—are observed during those periods.
October 25th to 30th was mostly in week 44. I’d call that a bullseye. But since then, thankfully, we’ve had unusually warm weather for this time of year and the cases have dropped to below 9,000 a day. Full disclosure: I don’t believe Humidity affects the spread in a 1-to-1 manner. Its more complex. Because a virus likes this spreads progressively. Hence why you see a few more days of high infections, even though it was only 4 days of low humidity. The spread has a certain ‘Enertia‘
The current forecast
Look at the first image again. That’s today’s weather in The Netherlands. And the KNMI forecast for this week is mostly the same as today. So we are heading for a week 45 of dry, low humidity weather. Day’s of ‘Code Red‘. I built this website so that people would know when to put on ‘their umbrella’ (ie. a face mask) or, even better, increase humidity inside of locations where people come together.
Now I know that even the National Weather Service gets it wrong, once in a while. And of course I feel hesitant to make predictions because odds are, if I get it wrong – even just a little bit – certain people will pounce on it to dismiss our research (now they’re getting away with just ignoring it). But I have to stand by my work.
So I forecast that we will see a steep increase in COVID-19 cases in 9-to-11 days from now, which – I kid you not – is Friday the 13th of November. I wrote about ‘Cosmic Jokes’ before.
For the record: I don’t want to be right and I wished Professor Wallinga, at RIVM, had taken the time to review our research. Especially considering its a topic (Humidity) he knows A LOT about.
Edsard Ravelli